Plot Heatmaps
Table of Contents
- Reducing a heatmap by filtering for specific vlaues
- Plotting a heatmap on data with multiple replicates
- Adjusting the aesthetics of a heatmap
- Clustering a heatmap by rows or columns
- Sorting a heatmap by rows or columns
- Adding colors to label either the rows or columns
- Command-Line arguments
Heatmaps are very useful for identifying patterns in your data. You can use the heatmap function of AMiGA to visually compare a specific growth parameter under different conditions. For example, the below will plot a heatmap with normalized growth rate norm(auc) as the value, Strain on the x-axis, and Substrate on the y-axis. The heatmap will be saved as a PDF file in the summary folder.
amiga heatmap -i /home/outbreaks/erandomii/summary/Biolog_ERandomii_summary_normalized.txt -o Biolog_ERandomii_Norm_AUC -x Isolate -y Substrate -v "norm(auc)" --title "Normalized AUC"
Here, all of the above arguments are required except for the title which is optional. This will generate a file Biolog_ERandomii_Norm_AUC.pdf which will be a very heatmap of 191 rows (substrates) and 4 columns (isolates). This is a very large heatmap so I am limiting its display below. We can however use the --filter argument to reduce the size of the heatmap and focus on substrates that matter, i.e. ones that support growth.

Reducing a heatmap by filtering for specific vlaues
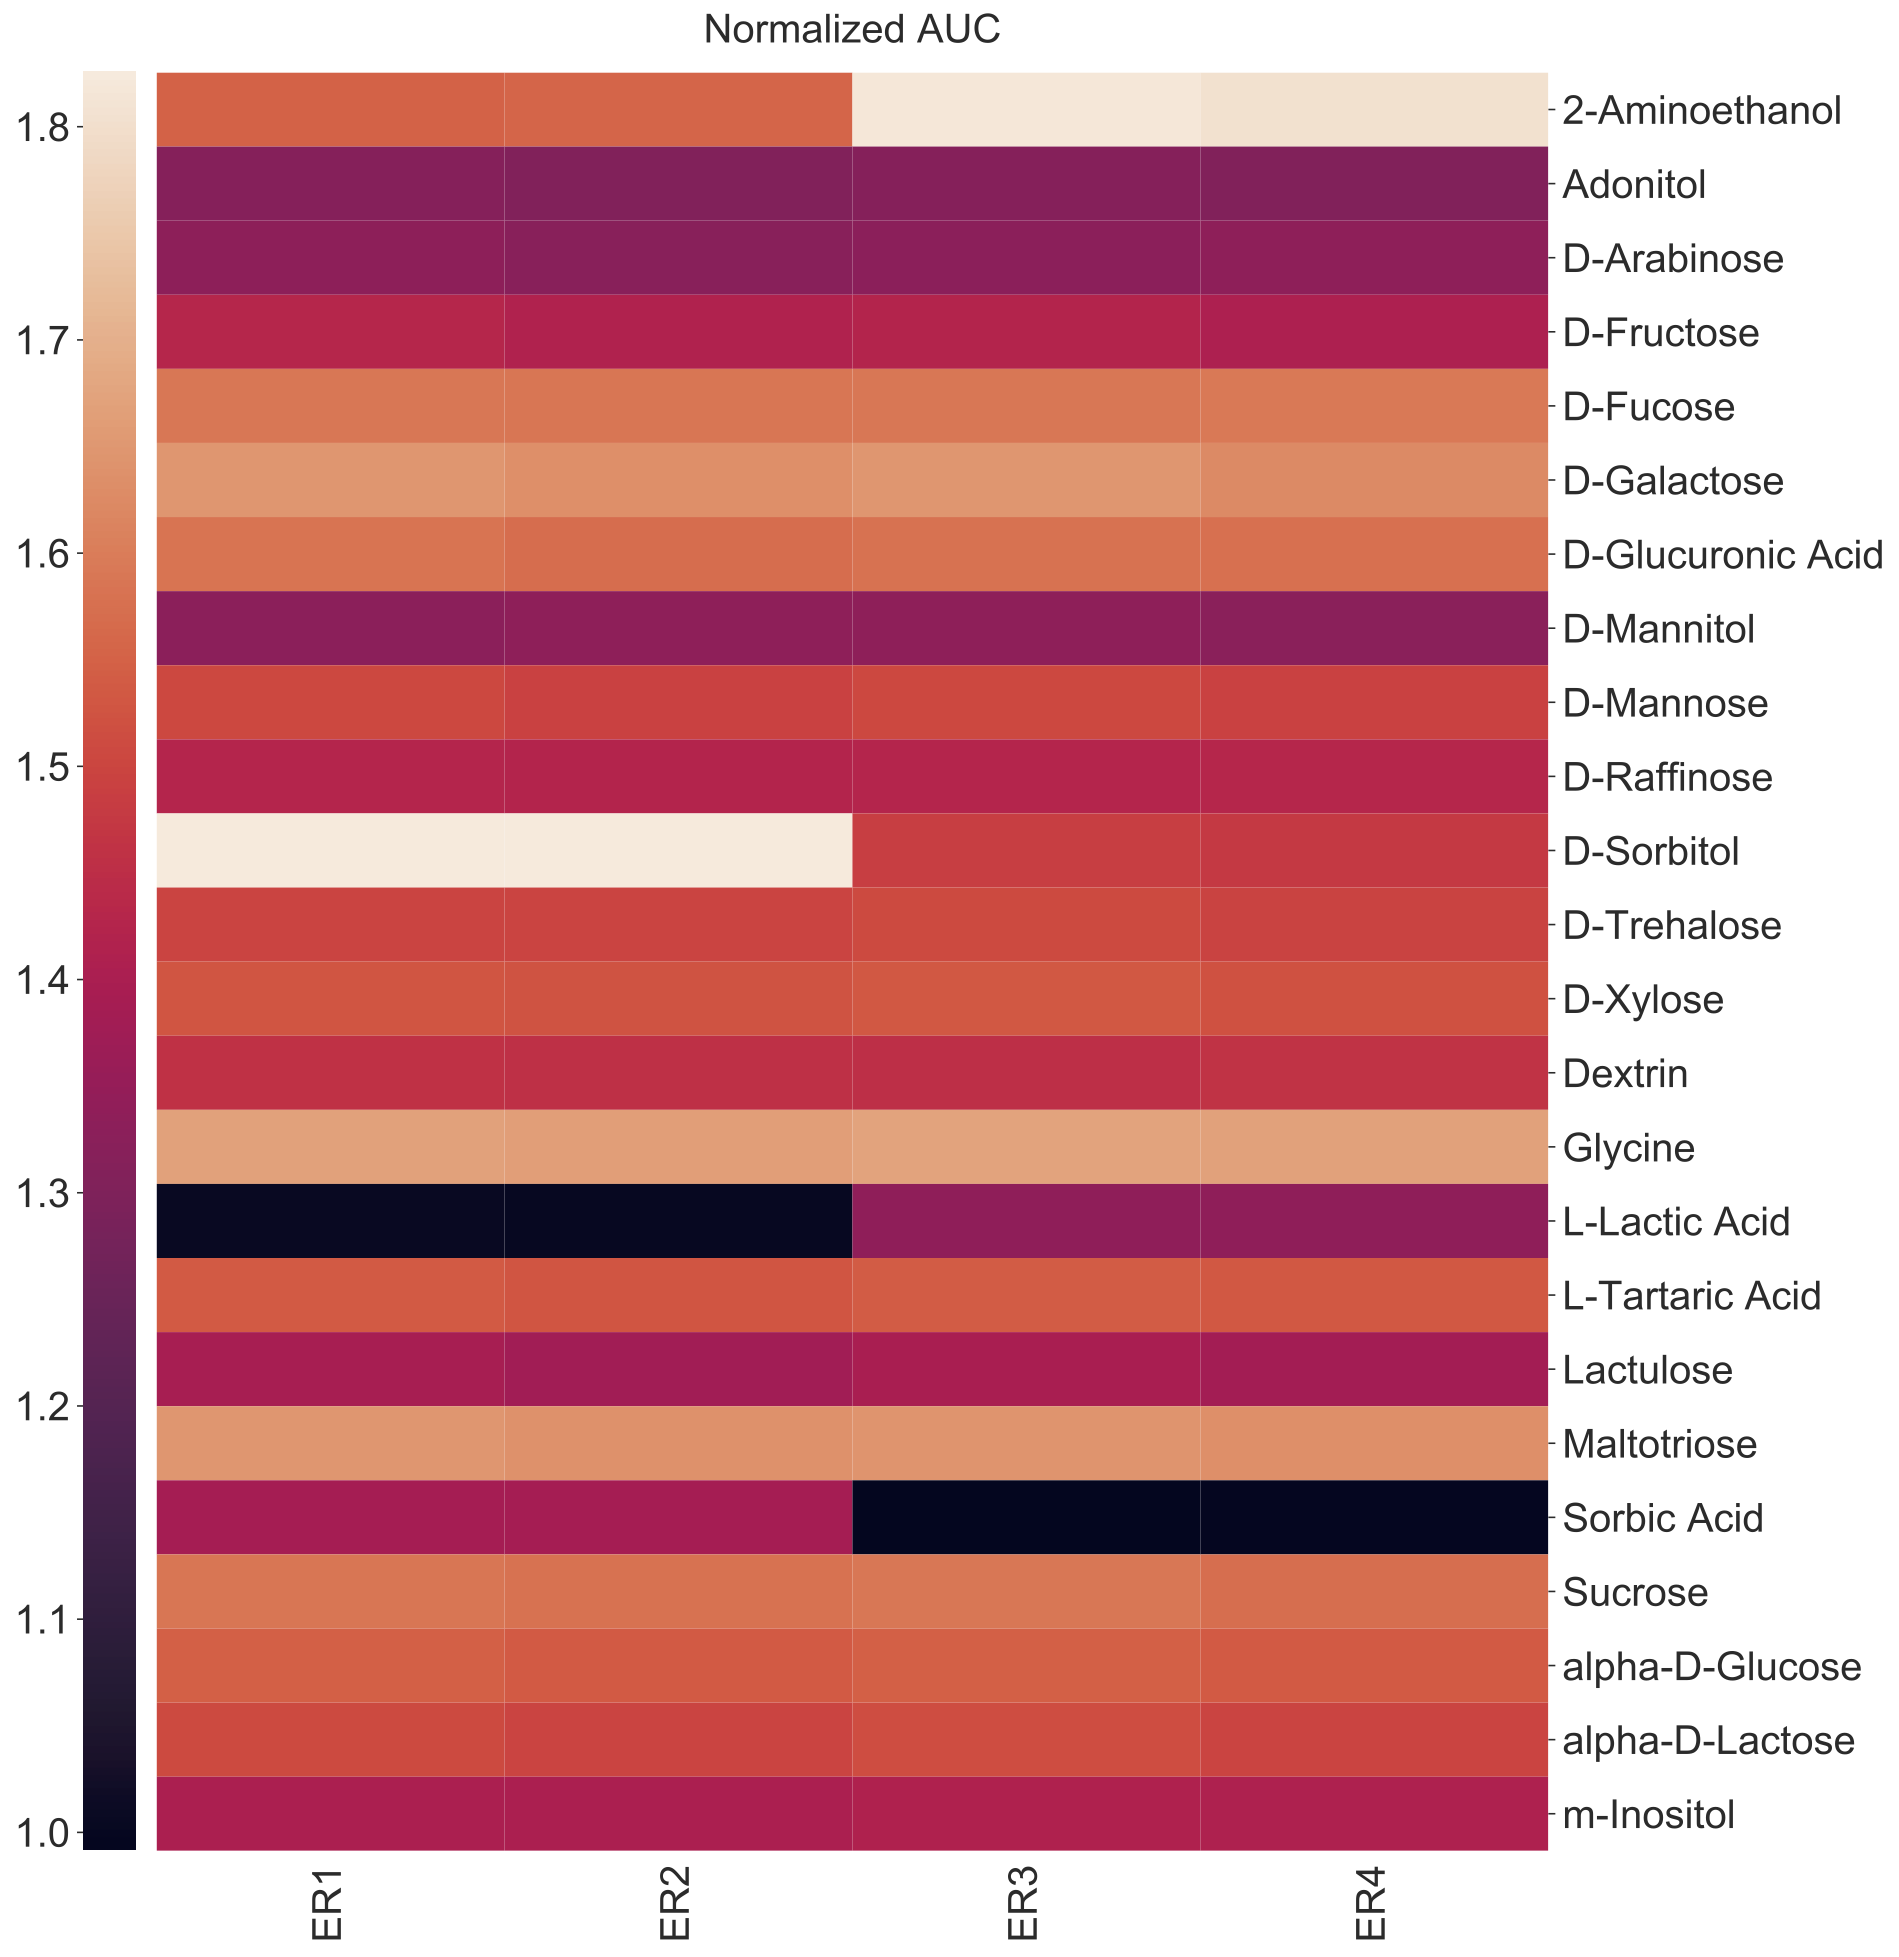
Let us assume that you are analyzing Biolog PM plate where and you only want to select for substrates that support the growth of any of the isolates above a certain threshold, then you should use the -f or --filter argumnet. See the help section below for more details.
amiga heatmap -i /home/outbreaks/erandomii/summary/Biolog_ERandomii_summary_normalized.txt -o Biolog_ERandomii_Norm_AUC_Filtered -x Isolate -y Substrate -v "norm(auc)" --title "Normalized AUC" --filter "row any > 1.2" --verbose
Plotting a heatmap on data with multiple replicates
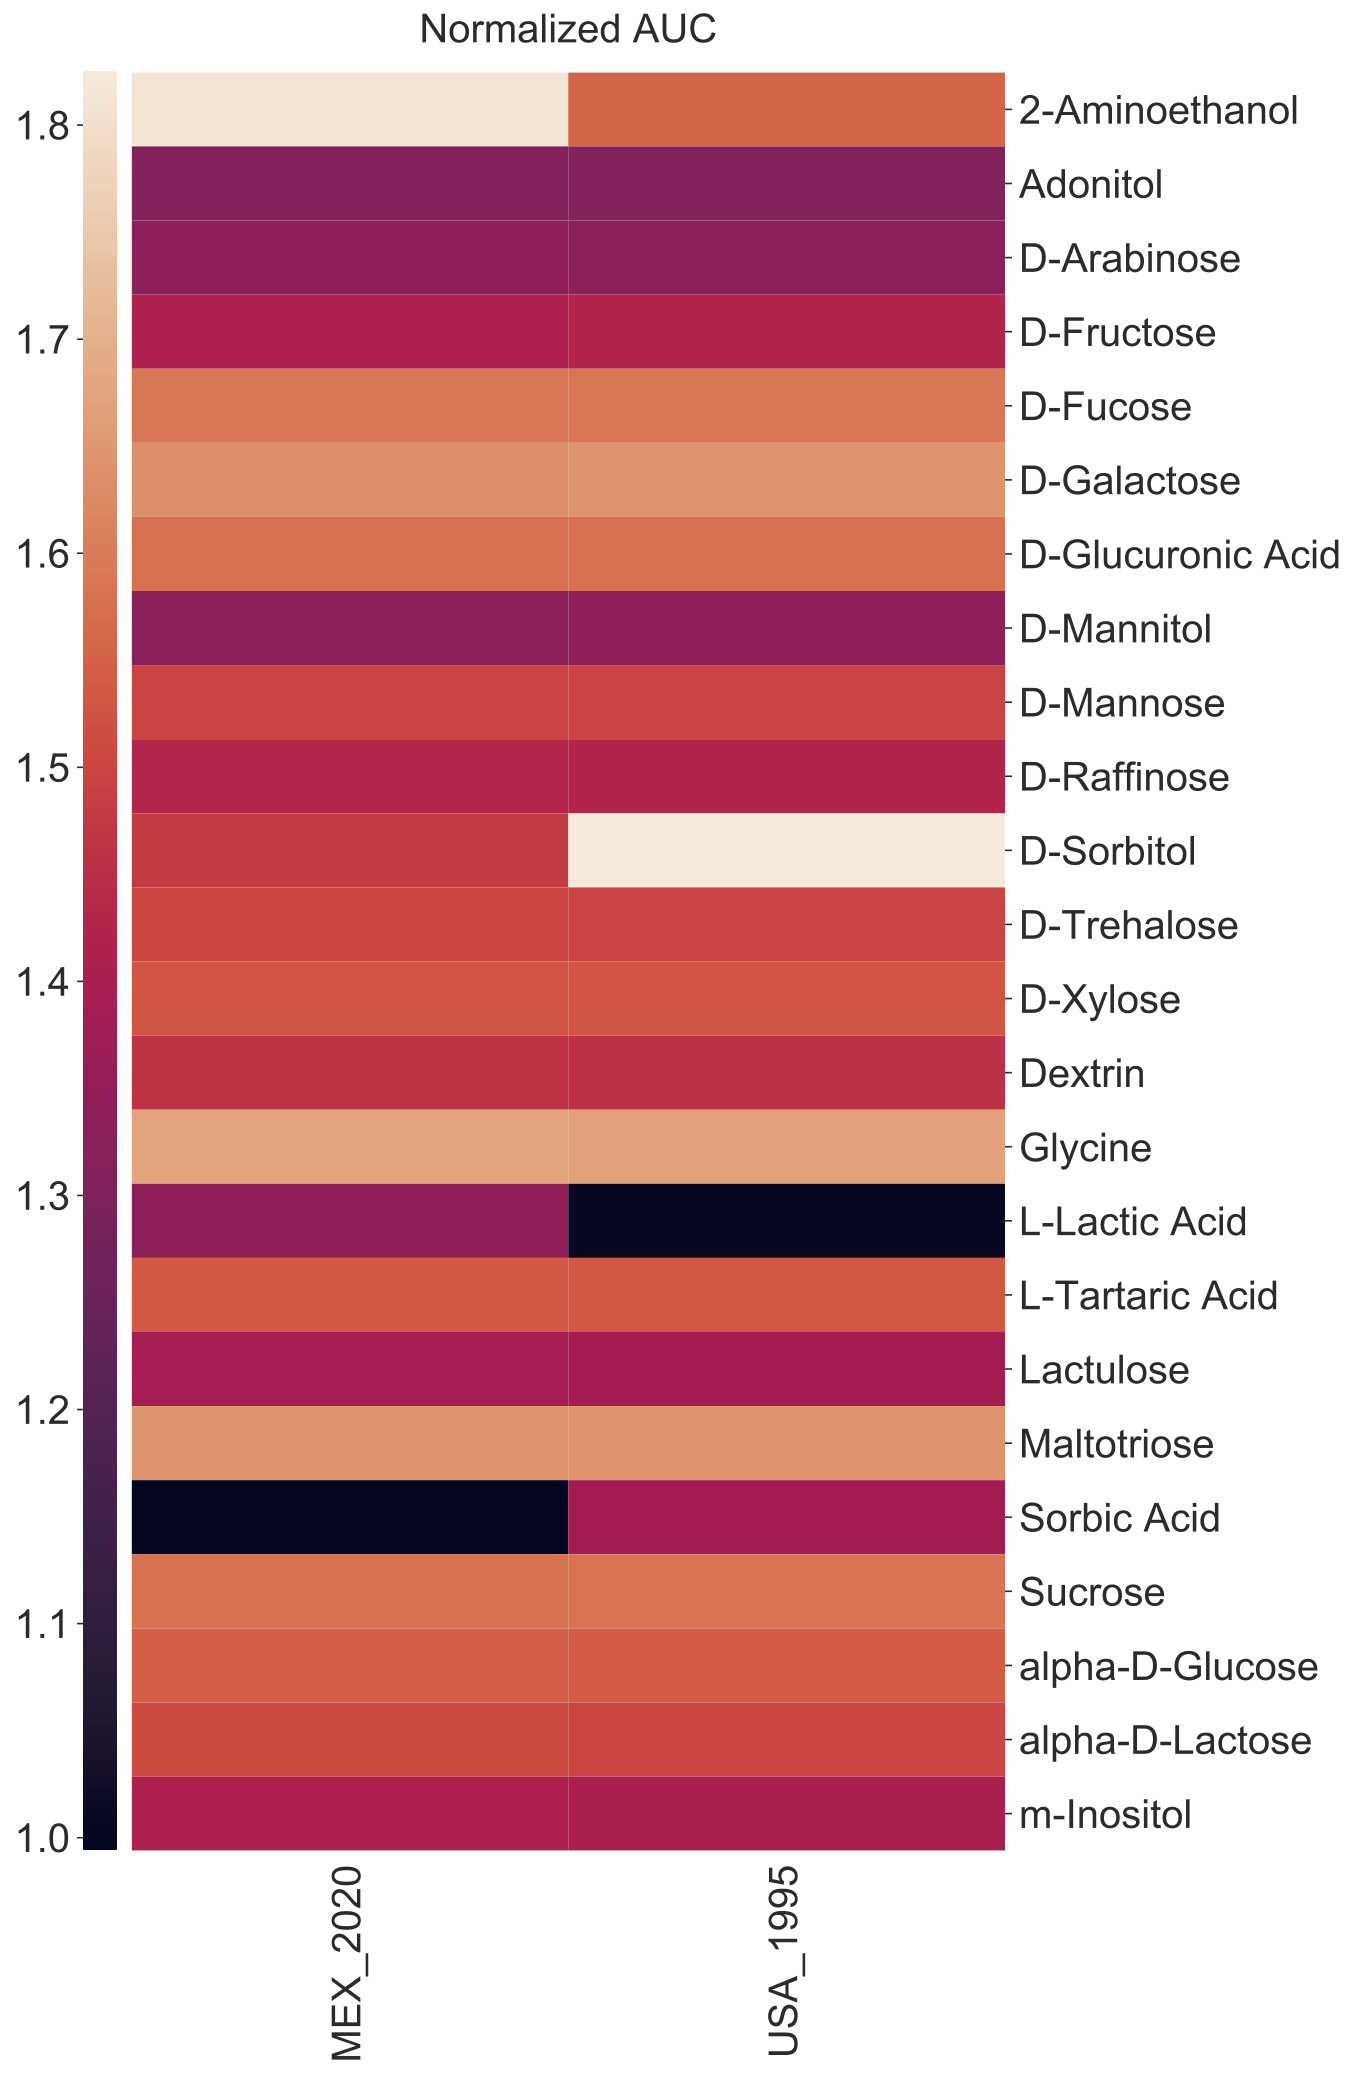
If the summary file included multiple replicates of the same condition, you will have to indicate whether you want to average these replicates using either the mean or median with the -p or --operation argument. In the next example, we will plot the Strain instead of Isolates for the columns. Because our data contains two isolates per strain, we need to aggregate them so we will prompt the heatmap function to use the --operation or -p of mean (i.e. averaging values across replicate conditions). An alternative is using the median.
amiga heatmap -i /home/outbreaks/erandomii/summary/Biolog_ERandomii_summary_normalized.txt -o Biolog_ERandomii_Norm_AUC_Filtered_Average -x Strain -y Substrate -v "norm(auc)" -p "mean" --title "Normalized AUC" --filter "row any > 1.2" --verbose
Adjusting the aesthetics of a heatmap
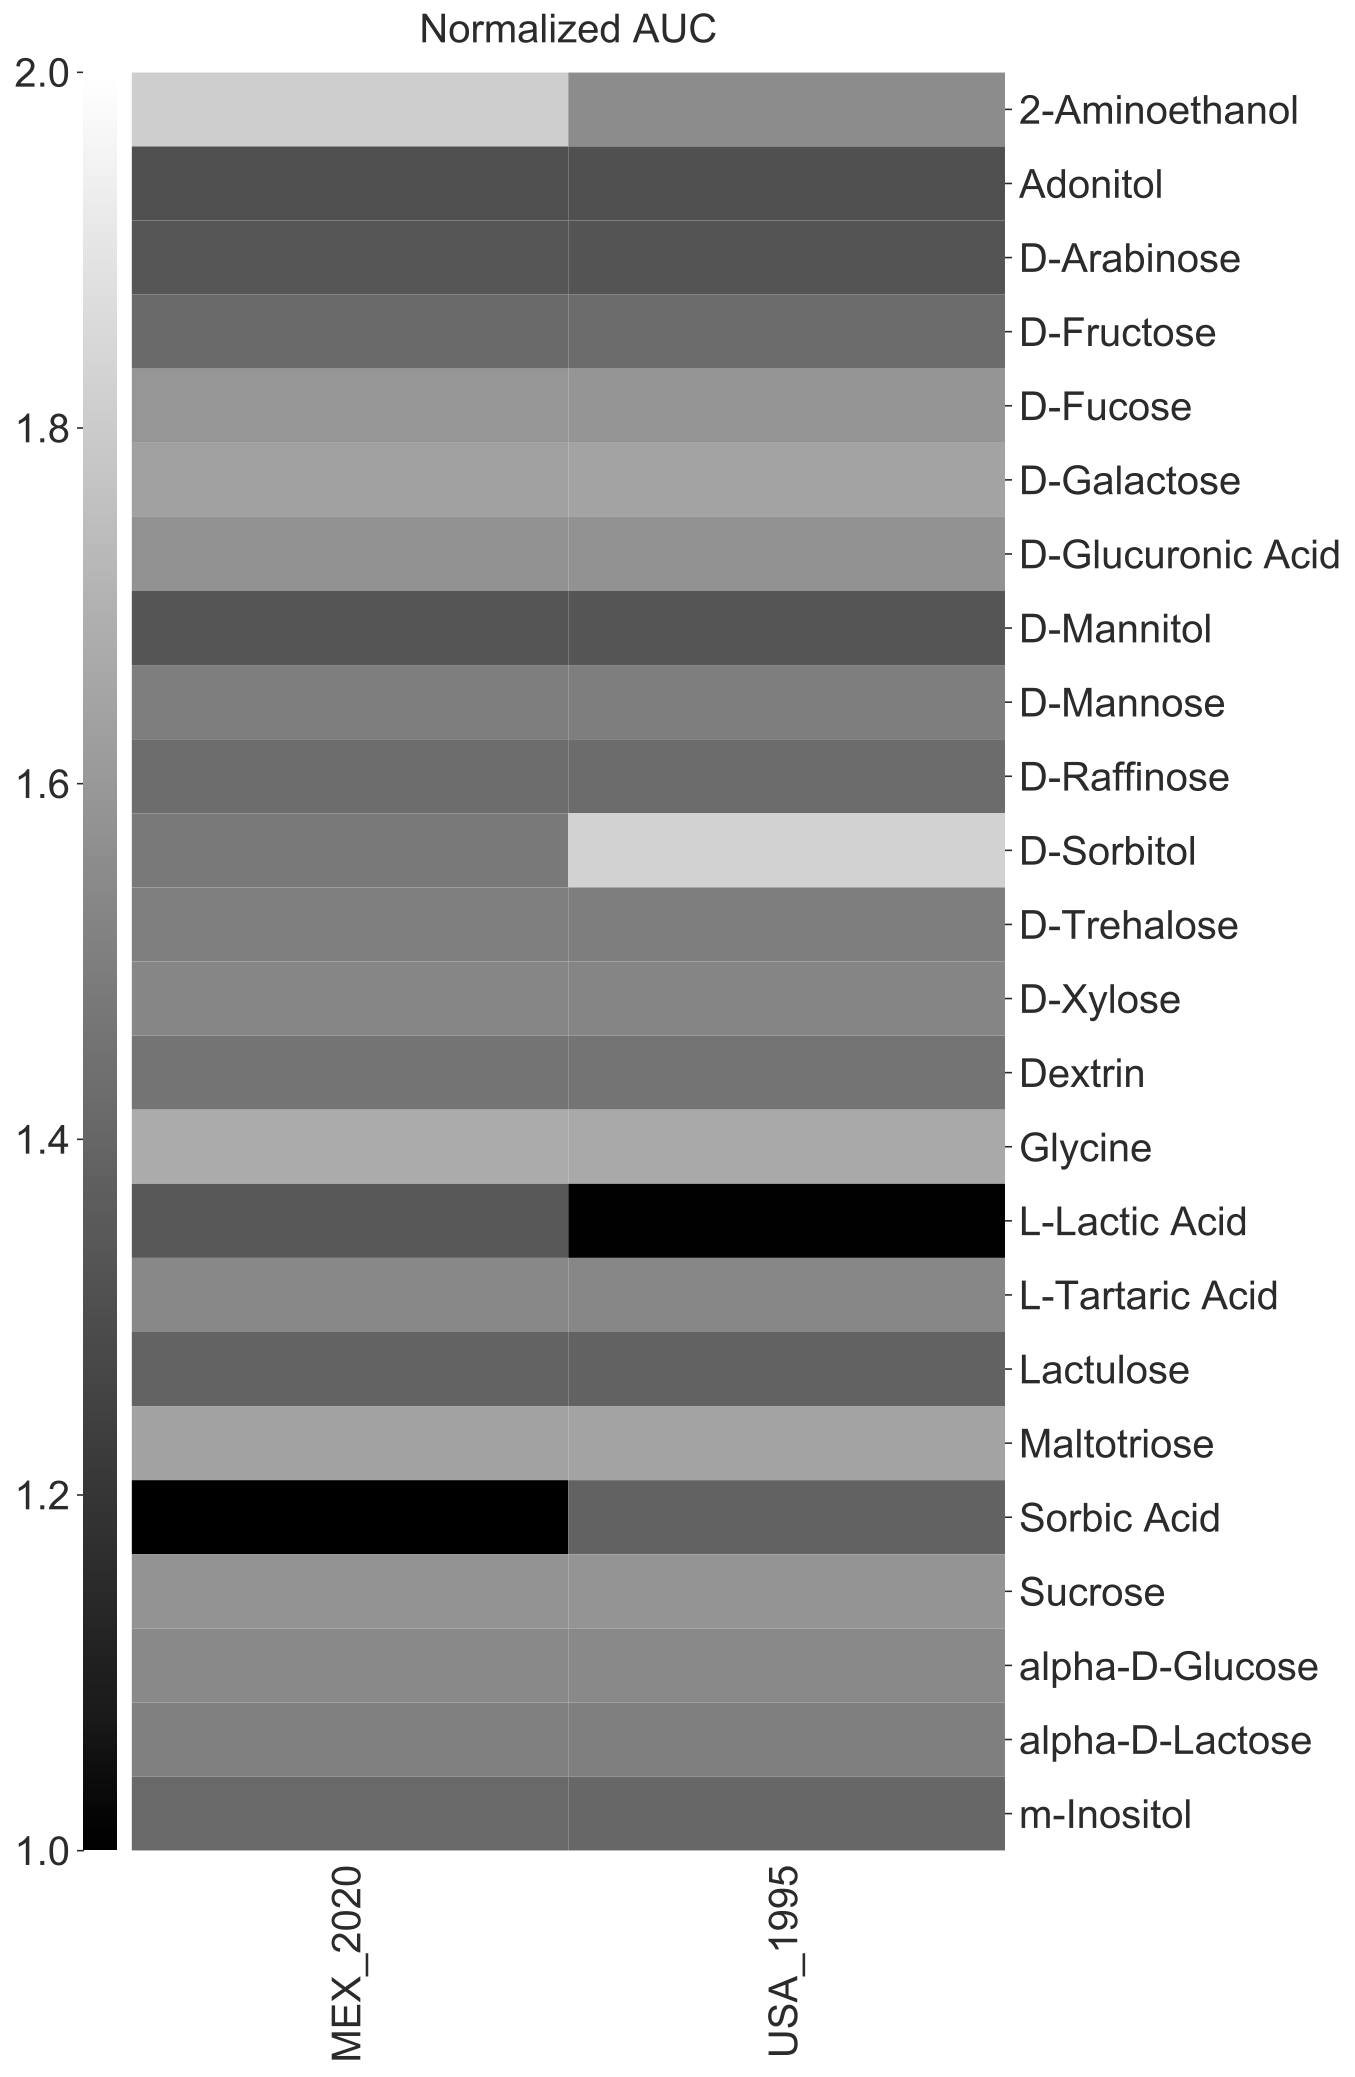
This is done by passing the --kwargs argument which directly pipes user arguments to the Seaborn heatmap function (see below). The key and value of each agument are separted by a colon. For example,
amiga heatmap -i /home/outbreaks/erandomii/summary/Biolog_ERandomii_summary_normalized.txt -o Biolog_ERandomii_Norm_AUC_Filtered_Average_Greys -x Strain -y Substrate -v "norm(auc)" -p "mean" --title "Normalized AUC" --filter "row any > 1.2" --kwargs "cmap:gray;vmin:1;vmax:2" --verbose
Some of the most useful arguments include:
cmap: defines the colormap used by the heatmap. See list of available colormaps here.vmin,center, andvmax: define the minimum, center, and maximum value of the colorbar.row_clusterandcol-cluster: See next section
WARNING: not all of the arguments will be accepted. AMiGA here is limited to accepting boolean values (i.e. True or False), strings (i.e. alpha-numeric characters), and numebrs. Some of the arguments may also be over-ridden by AMiGA. In future updates, I may give more flexibility in accepting more of these arguments.
Clustering a heatmap by rows or columns
To cluster the heatmap either by rows and/or columns, make sure to include either row_cluster:True and/or col_cluster:True in the --kwargs argument. For example,
amiga heatmap -i /home/outbreaks/erandomii/summary/Biolog_ERandomii_summary_normalized.txt -o Biolog_ERandomii_Norm_AUC_Filtered_Average_Greys_Clustered -x Strain -y Substrate -v "norm(auc)" -p "mean" --title "Normalized AUC" --filter "row any > 1.2" --kwargs "cmap:gray;vmin:1;vmax:2;row_cluster:True;col_cluster:True" --verbose
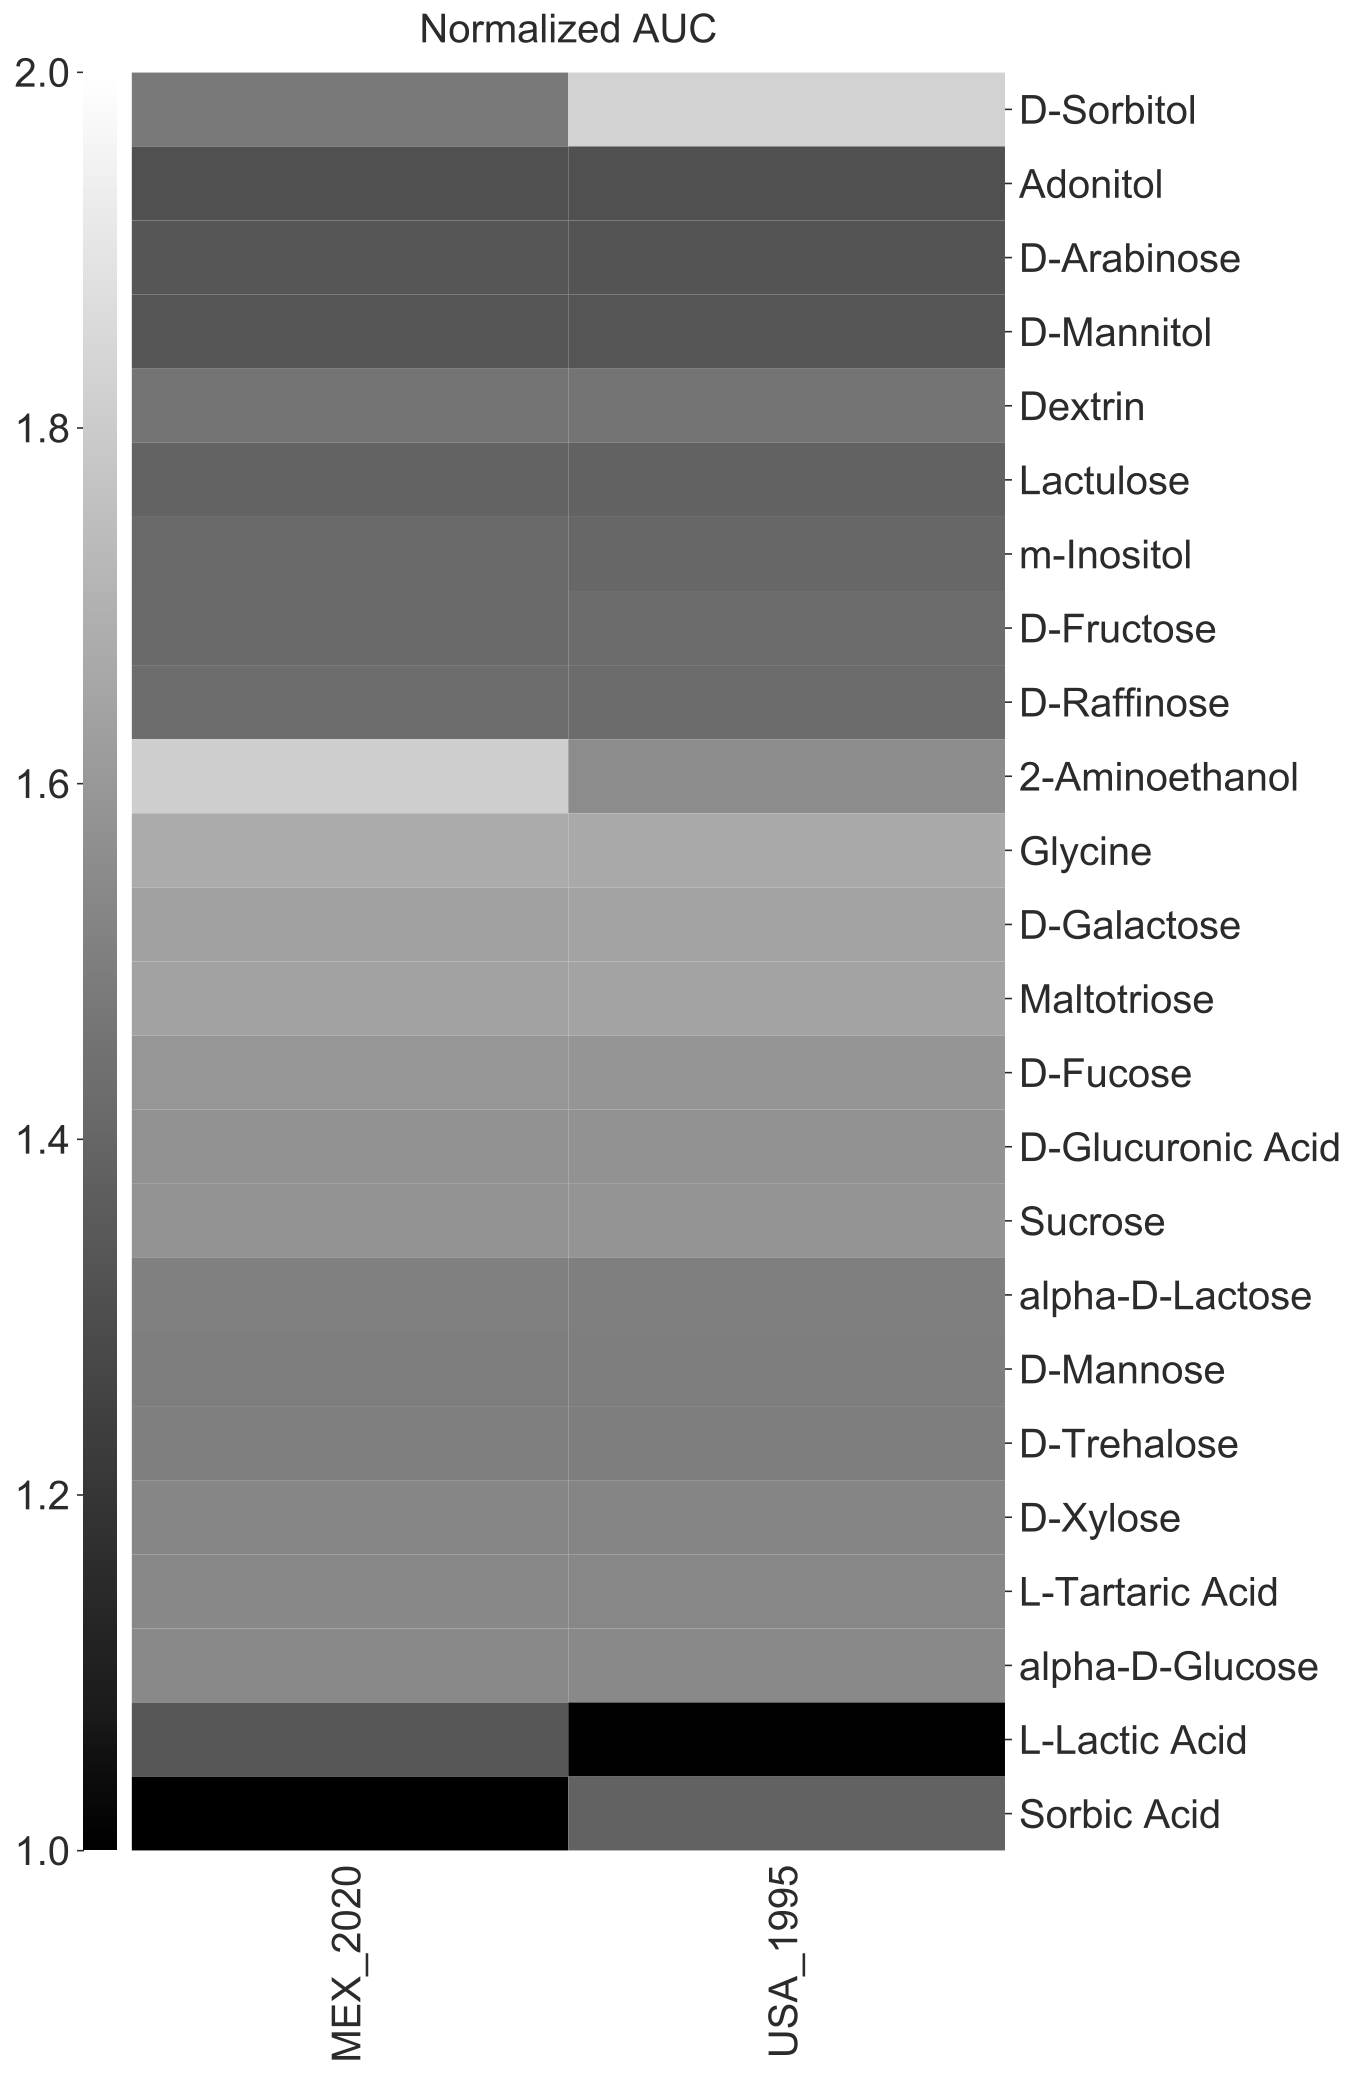
Users can also cluster either rows or the columns with the --cluster-x or --cluster-y arguments, respectively.
amiga heatmap -i /home/outbreaks/erandomii/summary/Biolog_ERandomii_summary_normalized.txt -o Biolog_ERandomii_Norm_AUC_Filtered_Average_Greys_Clustered -x Strain -y Substrate -v "norm(auc)" -p "mean" --title "Normalized AUC" --filter "row any > 1.2" --kwargs "cmap:gray;vmin:1;vmax:2" --verbose --cluster-x --cluster-y
Sorting a heatmap by rows or columns
If the heatmap has a single row or column, the cells will be sorted by value. The user can also request sorting by a specific meta-data variable. This variable must be included in the input summary file as a column.
amiga heatmap -i /home/outbreaks/erandomii/summary/Biolog_ERandomii_summary_normalized.txt -o Biolog_ERandomii_Norm_AUC_Filtered_Average_Greys_Clustered -x Strain -y Substrate -v "norm(auc)" -p "mean" --title "Normalized AUC" --filter "row any > 1.2" --kwargs "cmap:gray;vmin:1;vmax:2" --verbose --sort-x-by Isolate --cluster-y-by Substrate_Type
This hypothetical example would sort the x-axis (columns) by Isolate name and the y-axis (rows) by Substrate_Typ. In this example, Substrate_Type is for example either Monosaccharide,Disaccharide,Sugar alcohol, …, etc.
Adding colors to label either the rows or columns
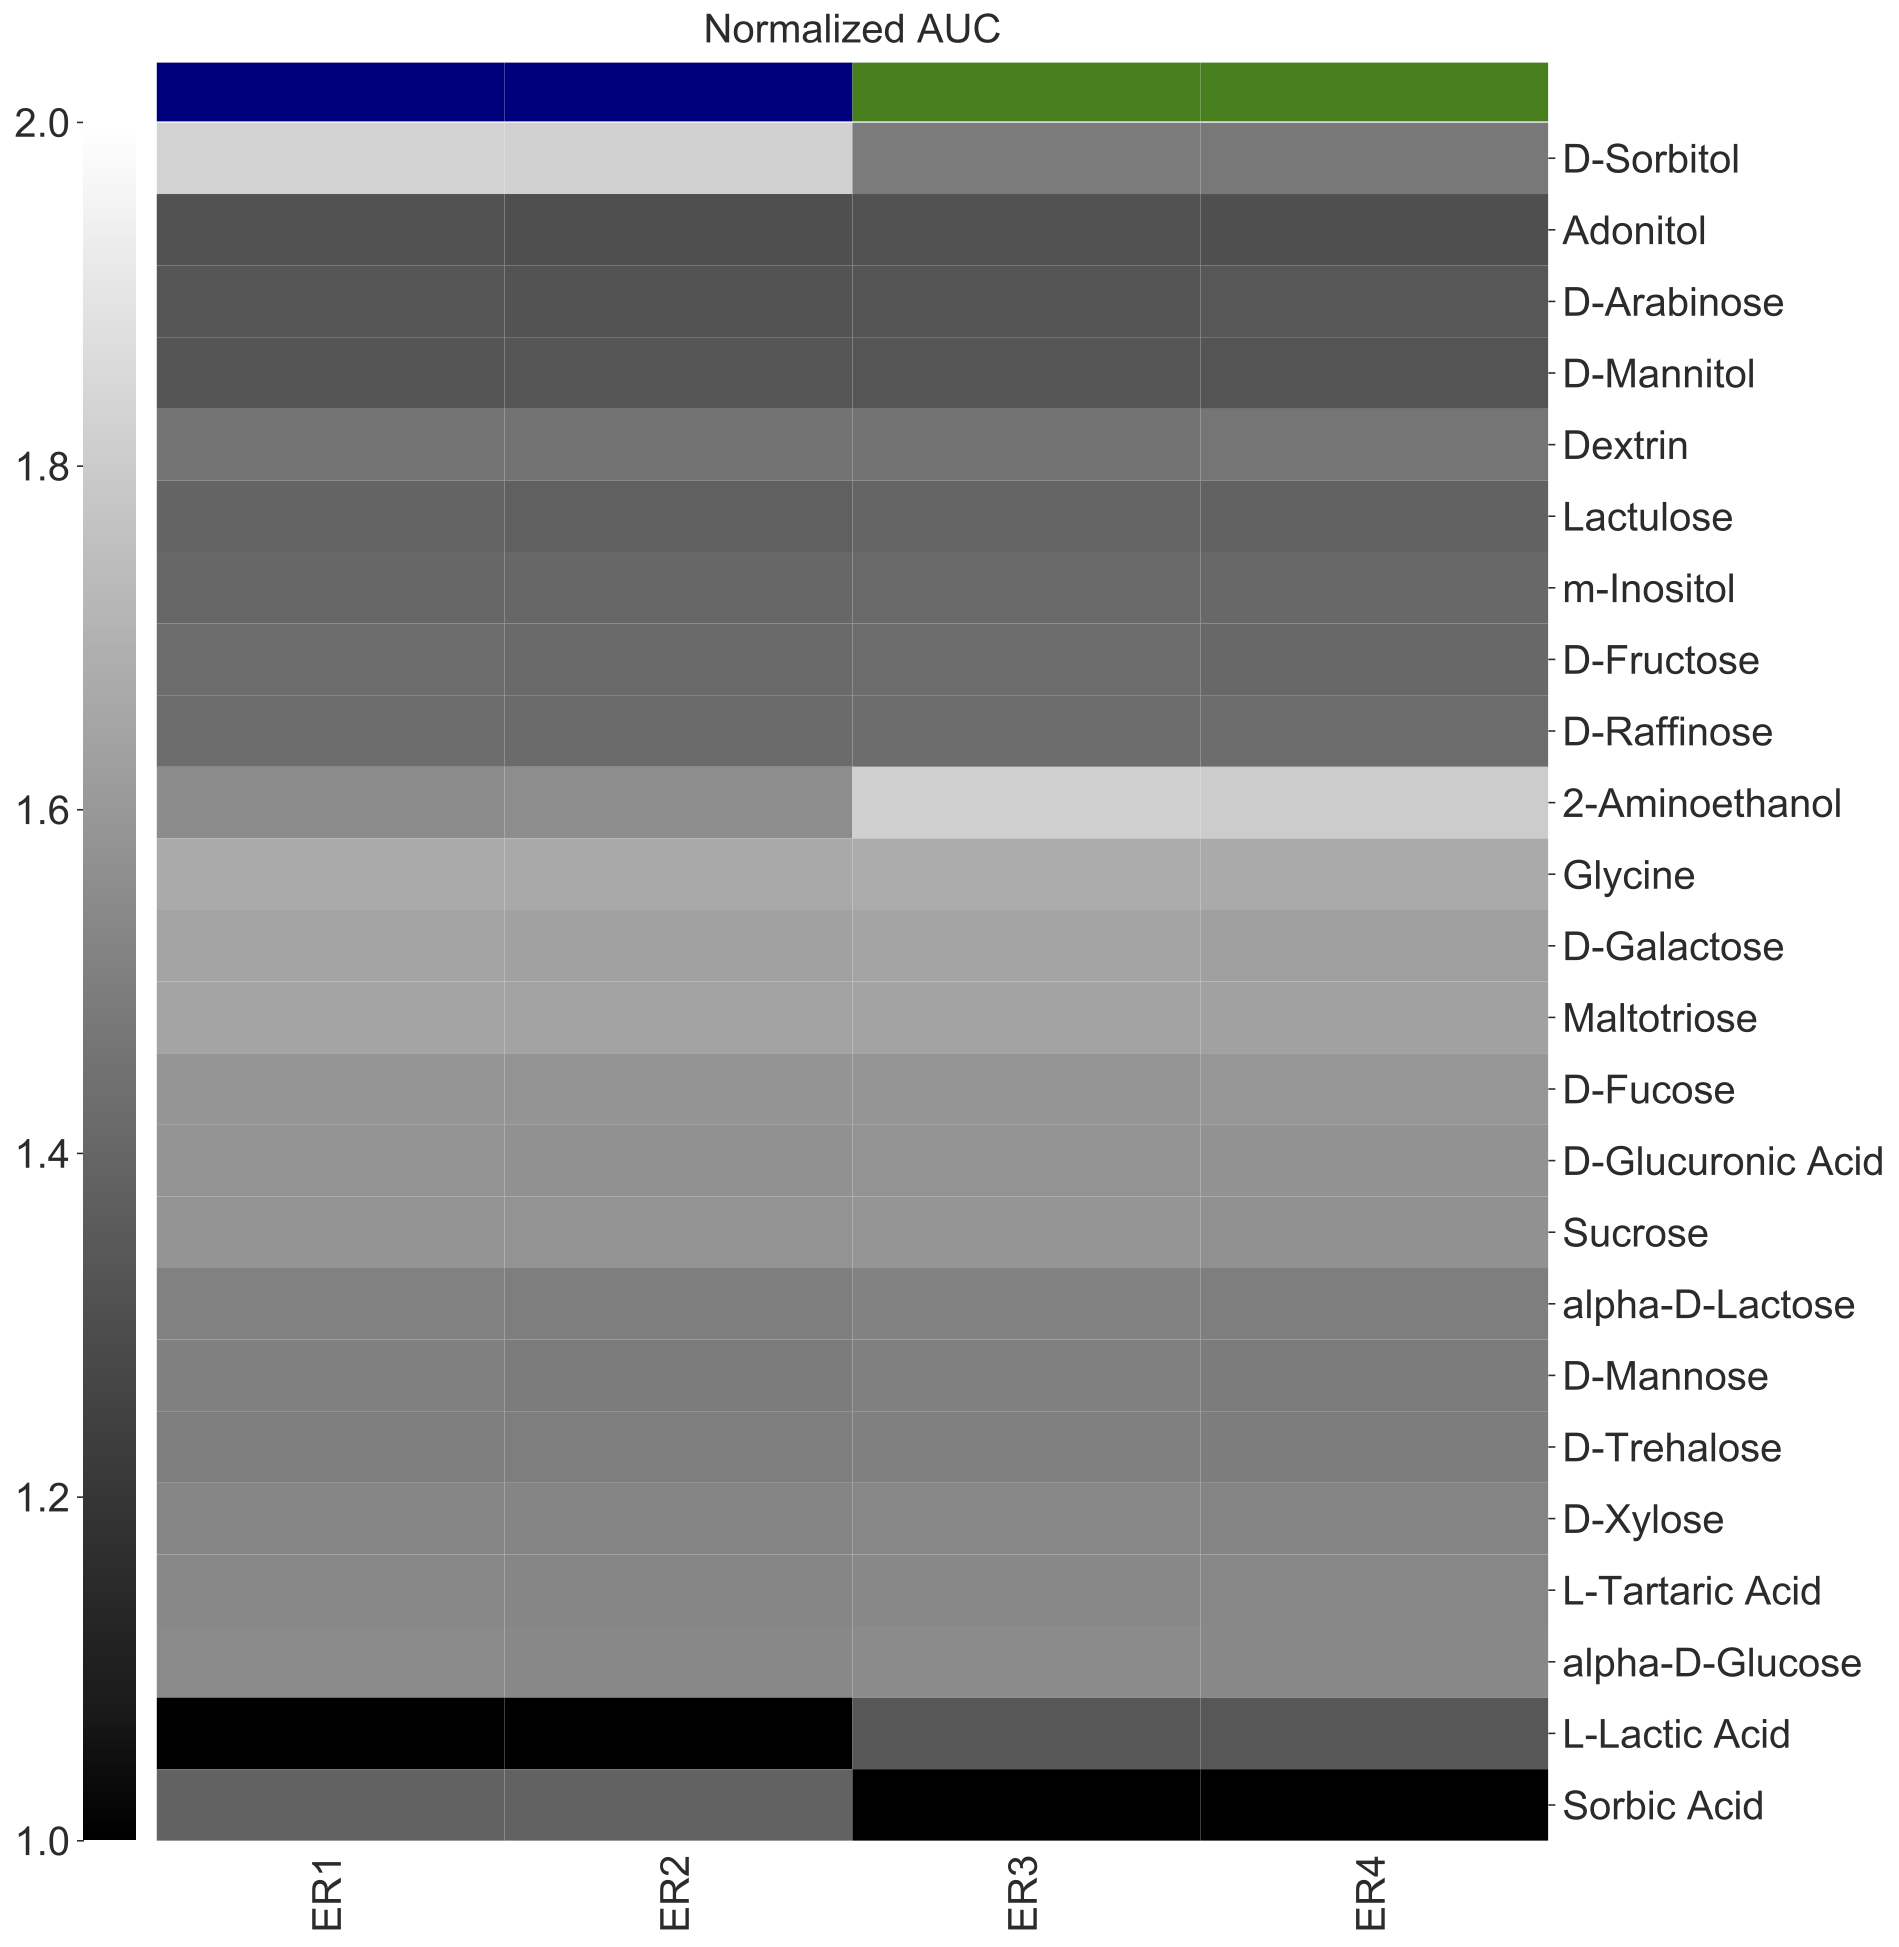
This is useful to evaluate if your data clustered in a certain way. Here, we want to plots the four isolates as column but distinguish their Strain with a color label. Notice that the -x arugment is now Strain and we added two more arguments --color-x-by and --color-scheme-x.
amiga heatmap -i /home/outbreaks/erandomii/summary/Biolog_ERandomii_summary_normalized.txt -o Biolog_ERandomii_Norm_AUC_Filtered_Average_Greys_Clustered -x Strain -y Substrate -v "norm(auc)" -p "mean" --title "Normalized AUC" --filter "row any > 1.2" --kwargs "cmap:gray;vmin:1;vmax:2;row_Cluster:True;col_cluster:True" --color-x-by "Strain" --color-scheme-x "USA_1995:navy;MEX_2020:green" --verbose
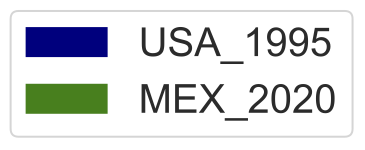
--color-y-byindicates that the user want to color rows (on y-axis) by the Strain value corresponding to each row.--color-schemeexplicitly assigns colors to each strain. Color assignments are sepearted by a semicolon (;), and eachStrain(because it is the argument for--color-y-by) is followed by a colon (:) and then the color of choice. See list of colors available here.
The legend is saved as a separate PDF.
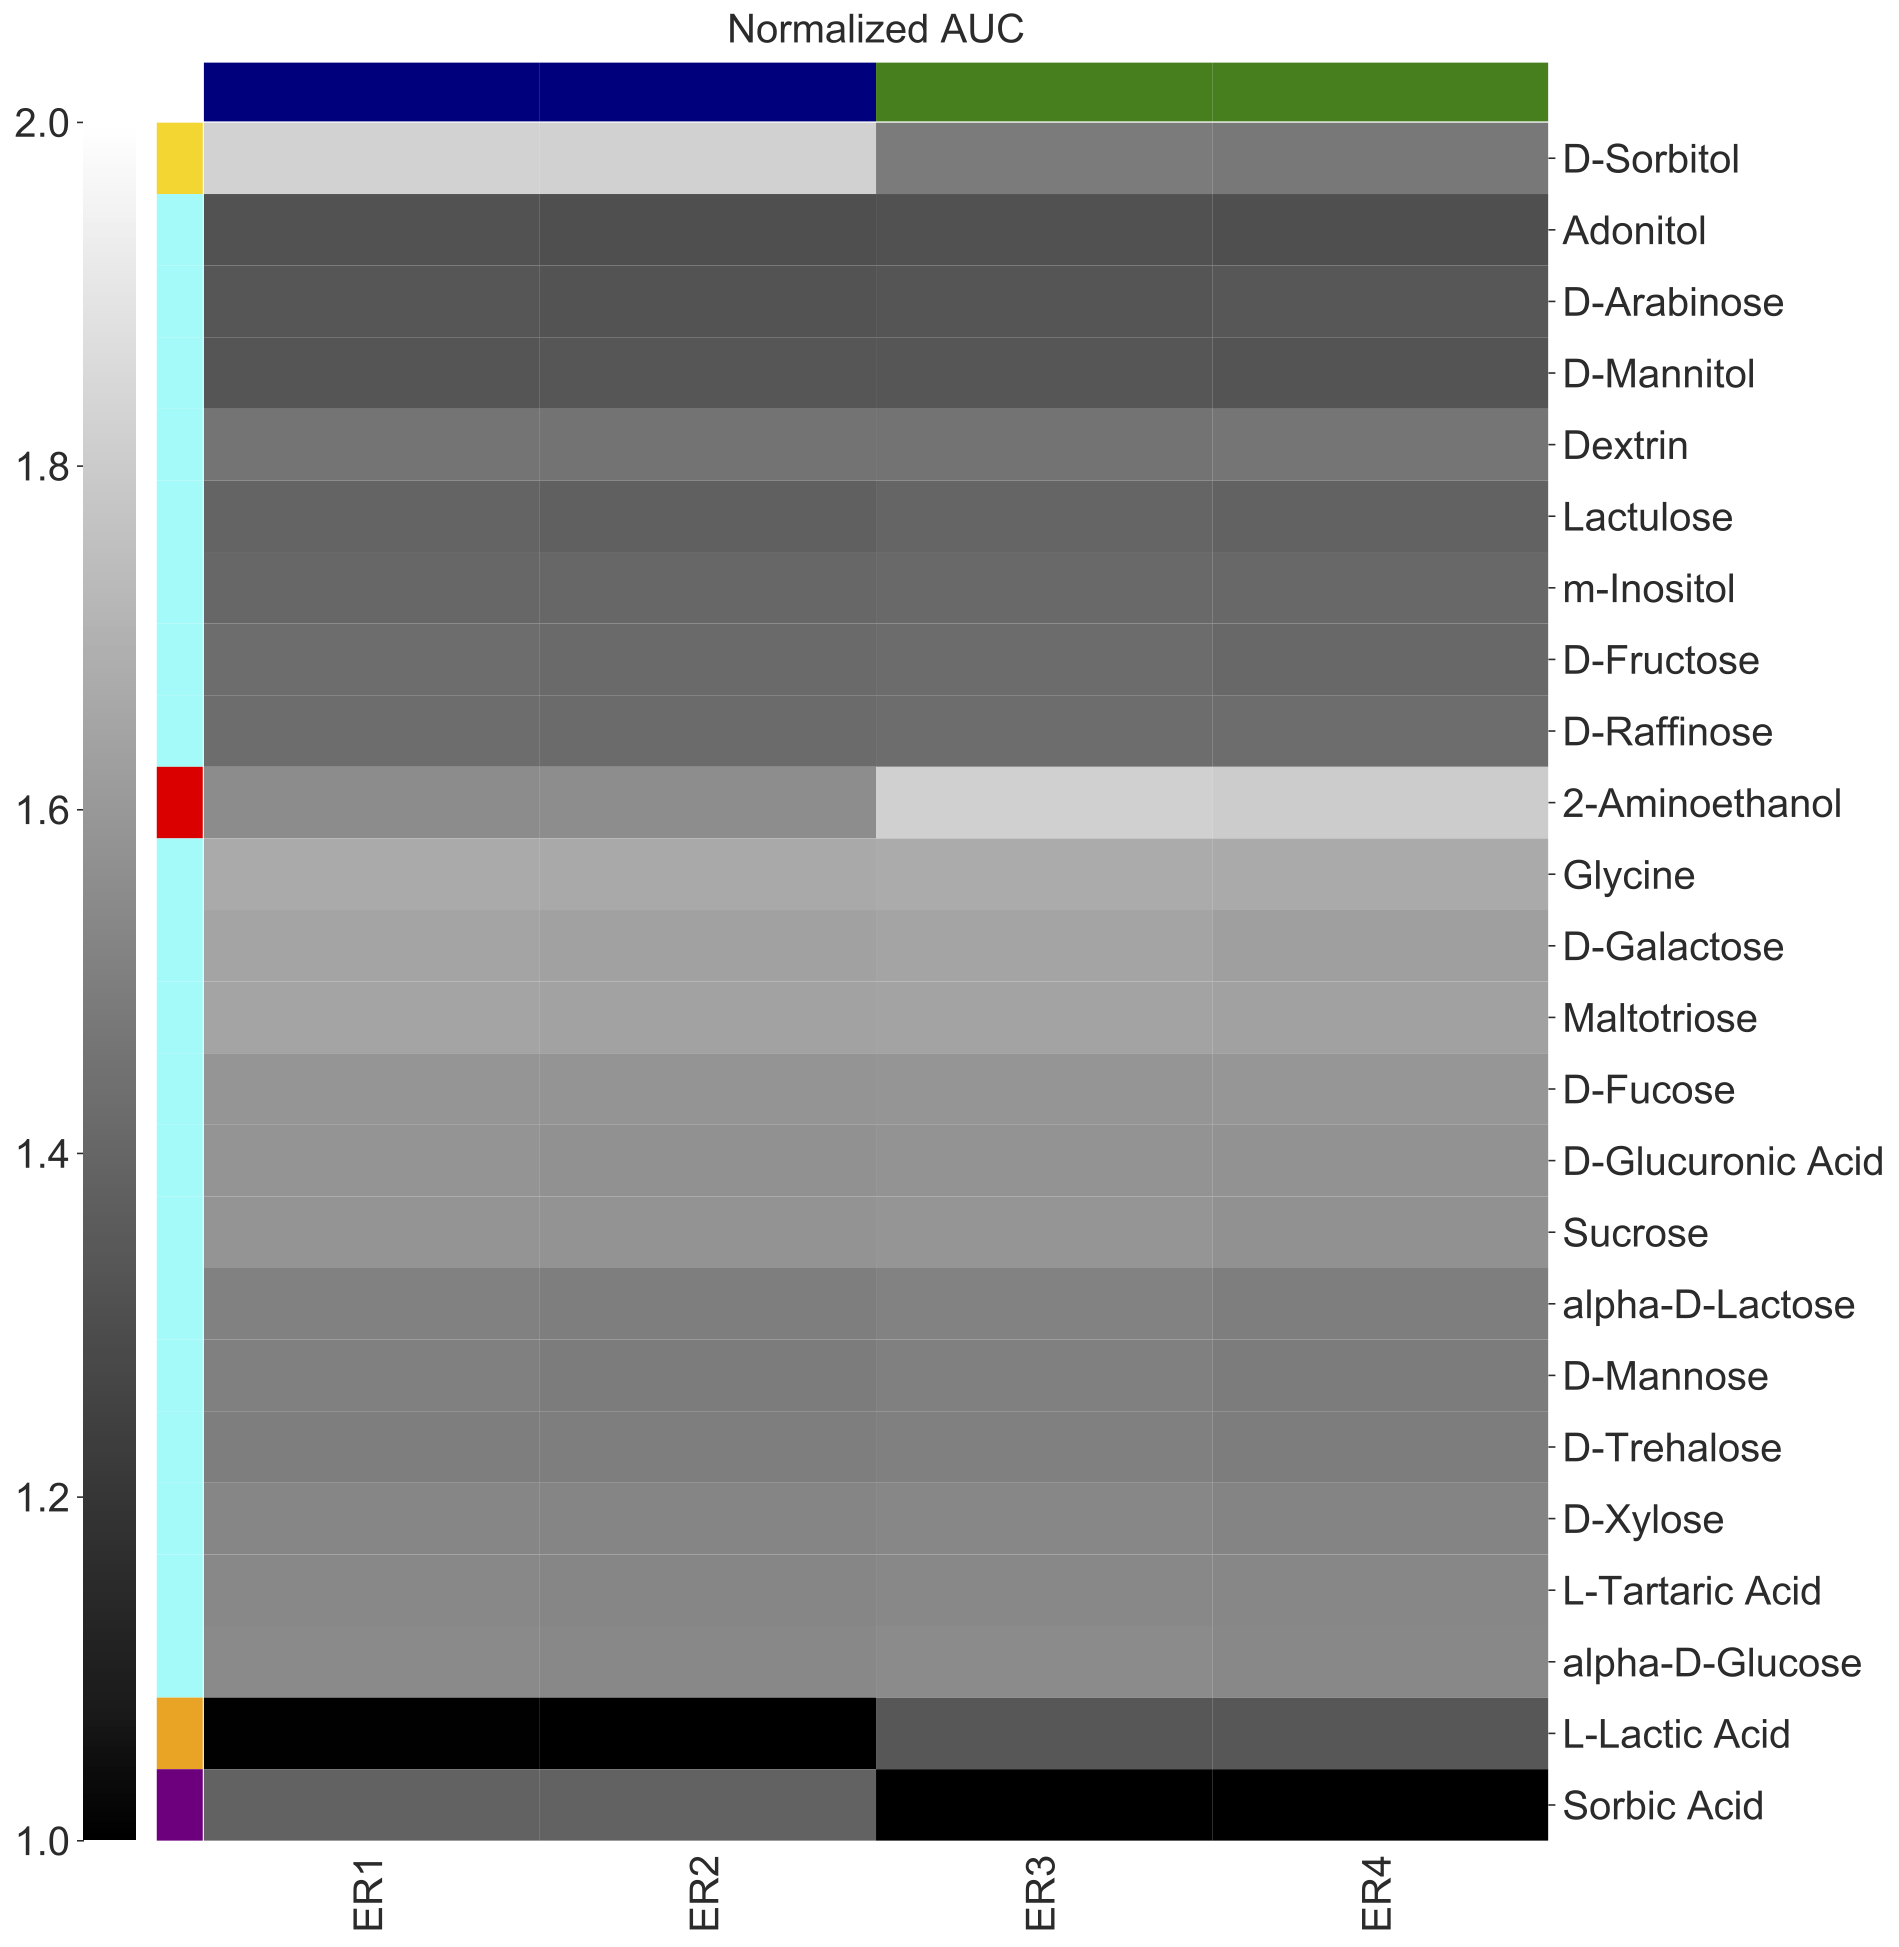
Users can also add colors to label the rows
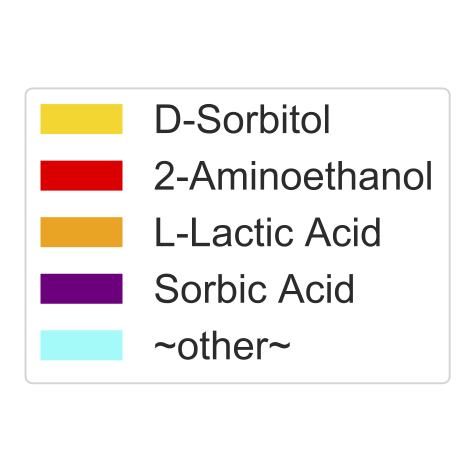
amiga heatmap -i /home/outbreaks/erandomii/summary/Biolog_ERandomii_summary_normalized.txt -o Biolog_ERandomii_Norm_AUC_Filtered_Average_Greys_Clustered_XY_Labeled -x Strain -y Substrate -v "norm(auc)" -p "mean" --title "Normalized AUC" --filter "row any > 1.2" --kwargs "cmap:gray;vmin:1;vmax:2;row_Cluster:True;col_cluster:True" --color-x-by "Strain" --color-scheme-x "USA_1995:navy;MEX_2020:green" --color-y-by "Substrate" --color-scheme-y "D-Sorbitol:gold;2-Aminoethanol:red;L-Lactic Acid:orange;Sorbic Acid:purple" --verbose
The legends are saved as a separate PDF.

Users cans also define colors using a text file
If you have lots of potential labels and you don’t want to pass them through the command line, create a tab-delimited table wand save it as a text file anywhere you would like. The header for the color column must be “Color”, but the header for the first column does not matter. For example,
head /home/outbreaks/erandomii/colors.txt
| Strain | Color |
|---|---|
| USA_1995 | navy |
| MEX_2020 | green |
amiga heatmap -i /home/outbreaks/erandomii/summary/Biolog_ERandomii_summary_filtered.txt -o Biolog_ERandomii_norm_gr_clustered -x Strain -y Substrate -v norm(gr) -p 'mean' --kwargs "cmap:gray;vmin:1;vmax:2;row_cluster:True;col_cluster:True" --title "Normalized Growth Rate" --color-y-by "Strain" --color-file-y "/home/outbreaks/erandomii/colors.txt" --color-x-by "PM" --color-scheme-x "1:lightgray;1:darkgray" --verbose
- Here I used the
--color-file-yinstead to pass the text file. You can do th same thing for labeling the coloumns with--color-file-xbut you will have to create a different text file that maps colors to the variable on the x-axis.
Users cans also adjust the proportion of the color bars or colorbar
Users can also adjust the propotion of the figure dedicated to the color labels. See --color-x-ratio, --color-y-ratio, and --colorbar-ratio.
Can I simply ask AMiGA to labels rows or columns without specifying colors?
Not at the moment. This is a feature that I may include at a later time.
What if I forgot to specify a color for some of the labels?
AMiGA will generate a random color that is very distinct from the colors that you did specify. It will use this random color to label any of the rows or columns that you did not specify. You can also pass your choice for labeling colors of undefined labels, for example --missing-color white will keep the label white for any labels for which you do not explicilty define a color.
Where is the legend or key for the labels?
AMiGA saves the legends as separate PDFs. Please look for it in the same location of your summary text file. It will have the suffix of either _x_legend.pdf o _y_legend.pdf.
Command-Line arguments
To see the full list of arguments that amiga heatmap will accept, run
amiga heatmap --help
which will return the following message
usage: amiga [-h] -i INPUT -o OUTPUT [-s SUBSET] -v VALUE -x X_VARIABLE -y
             Y_VARIABLE [-p {mean,median}] [-f FILTER] [-t TITLE]
             [--kwargs KWARGS] [--verbose] [--save-filtered-table]
             [--width-height WIDTH_HEIGHT WIDTH_HEIGHT]
             [--colorbar-ratio COLORBAR_RATIO] [--color-x-by COLOR_X_BY]
             [--color-y-by COLOR_Y_BY] [--color-file-x COLOR_FILE_X]
             [--color-file-y COLOR_FILE_Y] [--color-scheme-x COLOR_SCHEME_X]
             [--color-scheme-y COLOR_SCHEME_Y] [--color-x-ratio COLOR_X_RATIO]
             [--color-y-ratio COLOR_Y_RATIO] [--missing-color MISSING_COLOR]
             [--cluster-x] [--cluster-y] [--sort-x-by SORT_X_BY]
             [--sort-y-by SORT_Y_BY] [--keep-rows-missing-data]
             [--keep-columns-missing-data]
             [--x-tick-labels-scale X_TICK_LABELS_SCALE]
             [--y-tick-labels-scale Y_TICK_LABELS_SCALE]
             [--color-bar-labels-scale COLOR_BAR_LABELS_SCALE]
             [--x-rotation X_ROTATION] [--highlight-labels HIGHLIGHT_LABELS]

Plot a heatmap

optional arguments:
  -h, --help            show this help message and exit
  -i INPUT, --input INPUT
  -o OUTPUT, --output OUTPUT
  -s SUBSET, --subset SUBSET
  -v VALUE, --value VALUE
  -x X_VARIABLE, --x-variable X_VARIABLE
  -y Y_VARIABLE, --y-variable Y_VARIABLE
  -p {mean,median}, --operation {mean,median}
  -f FILTER, --filter FILTER
  -t TITLE, --title TITLE
  --kwargs KWARGS
  --verbose
  --save-filtered-table
  --width-height WIDTH_HEIGHT WIDTH_HEIGHT
  --colorbar-ratio COLORBAR_RATIO
                        Proportion of figure size devoted to color bar.
                        Default is 0.1
  --color-x-by COLOR_X_BY
  --color-y-by COLOR_Y_BY
  --color-file-x COLOR_FILE_X
  --color-file-y COLOR_FILE_Y
  --color-scheme-x COLOR_SCHEME_X
  --color-scheme-y COLOR_SCHEME_Y
  --color-x-ratio COLOR_X_RATIO
                        Proportion of the heatmap devoted to the column color
                        labels. Default is 0.1
  --color-y-ratio COLOR_Y_RATIO
                        Proportion of the heatmap devoted to the row color
                        labels. Default is 0.1
  --missing-color MISSING_COLOR
  --cluster-x
  --cluster-y
  --sort-x-by SORT_X_BY
  --sort-y-by SORT_Y_BY
  --keep-rows-missing-data
                        Drops columsn that have any missing data
  --keep-columns-missing-data
                        Drops rows that have any missing data
  --x-tick-labels-scale X_TICK_LABELS_SCALE
                        Must be between 0 (smallest) and 1 (largest).
  --y-tick-labels-scale Y_TICK_LABELS_SCALE
                        Must be between 0 (smallest) and 1 (largest).
  --color-bar-labels-scale COLOR_BAR_LABELS_SCALE
                        Must be between 0 (smallest) and 1 (largest).
  --x-rotation X_ROTATION
  --highlight-labels HIGHLIGHT_LABELS
-i or --input
Accepts a string which is the path to a working directory of summary files or a specific summary file. The path can be relative or absolute.
-o or --output
Accepts a string which defines the filename (no extension and no path) for your summary or data files. If no filename is passed , AMiGA will instead give output files a unique time stamp (e.g. 2020-08-26_09-09-59).
-s or --subset
Defines which files to be included in the analysis. See Data Subsetting for more details.
-v or --value
Defines which growth parameter to summaize with a heatmap.
-x or --x_variable
Defines the x-axis variable.
-y or --y_variable
Defines the y-axis variable.
-p or --operation
Defines the operation to be used for grouping replicates. Options are mean or median. If not used, AMiGA will assume that summary data do not include any replicates. If the summary data do include replicates, and no opeation is passed, this will result in a fatal error.
-f or --filter
Dictates how the heatmap will be reduced to smaller size by selecting for specific values. This uses an ad hoc symbolic language to communicate with AMiGA. Each filtering criteria requires four items. For example, row any >= 1.2 dictates that
- for each
rowin the heatmap (alternative iscol), - if
anyof the values (alterantive isall) - is
>=(alternatives are>,<,<=,=) - relative to a certain value, here
1.2.
Multiple criteria can be concatenated with an OR. For example, row any >= 1.2 OR row any = 1 OR row any <= 0.8 argument will force AMiGA to only display rows where any of the values are either larger than or equal to 1.2, equal to 1.0, or lower than or equal to 0.8.
-t or --title
Text argument for title of heatmap.
--kwargs
User can pass here some arguments to the Seaborn heatmap function. Arguments are separated by semi-colons. The key and value of each agument are separted by a colon. For example, center:1;vmin:0.
See more details for these arguments in Command Line Interface
--save-filtered-table
Save the input data after it has been reduced or filtered using the --filter argument. File will have the suffix _filtered.txt.
--width-height
Two numbers that define the width and height in inches (e.g. --width-height 5 10)
--colorbar-ratio
Ratio of width to height for the colorbar. Default is 0.1.
--color-x-by
Specifies the column in the summary file which you would like to use for labeling rows in the heatmap.
--color-y-by
Specifies the column in the summary file which you would like to use for labeling rows in the heatmap.
--color-file-x
Used to pass a tab-delimited text file containing a table that maps colors to values of the variable defined by --color-x-by.
--color-file-y
Used to pass a tab-delimited text file containing a table that maps colors to values of the variable defined by --color-y-by.
--color-scheme-x
Explicitly assigns colors to each value of the variable defined by --color-x-by. Color assignments are sepearted by a semicolon (;), and each Strain (because it is the argument for --color-x-by) is followed by a colon (:) and then the color of choice. See list of colors available here
--color-scheme-y
Explicitly assigns colors to each value of the variable defined by --color-y-by. Color assignments are sepearted by a semicolon (;), and each Strain (because it is the argument for --color-y-by) is followed by a colon (:) and then the color of choice. See list of colors available here
--color-x-ratio Defines the proportion of the heatmap devoted to the column color labels. Default is 0.1
--color-y-ratio Defines the roportion of the heatmap devoted to the row color labels. Default is 0.1.
--missing-color
Defines the color of the label for any samples for which the user does not define the color.
--cluster-x A boolean argument that requests clustering for rows.
--cluster-y A boolean argument that requests clustering for columns.
--sort-x-by
Defines which variable to use for sorting the columns. Variable must be included as a column in the input summary file. Sorting will not occur if user also requests clustering wiht --cluster-x.
--sort-y-by
Defines which variable to use for sorting the rows. Variable must be included as a column in the input summary file. Sorting will not occur if user also requests clustering wiht --cluster-y.
--keep-rows-missing-data
If your heatmap (matrix) has any missing values, you can opt to drop columns with missing values if you would like to retain all rows. Otherwise, rows with missing values will be dropped.
--keep-columns-missing-data
If your heatmap (matrix) has any missing values, you can opt to drop rows with missing values if you would like to retain all columns. Otherwise, rows with missing values will be dropped.
--x-tick-labels-scale Must between 0 and 1. Sets the size of the column labels with 1 being the maximum possible size.
--y-tick-labels-scale Must between 0 and 1. Sets the size of the row labels with 1 being the maximum possible size.
--color-bar-labels-scale Must between 0 and 1. Sets the size of the color bar numeric labels with 1 being the maximum possible size.
--x-rotation
Number that defines the rotation of the column labels. Default is 90.
--highlight-labels
User can pass an argument to highlight specific axes labels in bold red font. For example, y:MDA_113,SH_1149;x:D-Trehalose,D-Fructose will highlight the MAD_113 and SH_1149 labels on the y-axis and the D-Trehalose and D-Fructose labels on the x-axis. Labels will be highlighted only if detected.