Test Hypotheses
Table of Contents
- Basic usage
- Functional difference in OD
- Interpretation of model output
- Limitations of hypothesis testing
- Plotting aesthetics
- Command-Line arguments
AMiGA can perform Gaussian Process (GP) regression to test differential growth between distinct experimental conditions.o see the full list of arguments that AMiGA will accept for its test function, call amiga test --help.
Basic usage
amiga test -i /home/outbreaks/erandomii/ -s Isolate:ER1;PM:1;Substrate:Negative Control,alpha-D-glucose -y H0:Time;H1:Time+Substrate -tss 10 --subtract-control
Here, we first reduced our data set only to the growth curves of the isolate ER1 in PM1 plates on Negative Control (i.e. no carbon) and alpha-D-glucose wells. We then test the null hypothesis (H0) that only Time variable explains variation in OD against the alternative hypothesis (H1) that both Time and Substrate variables explain the variation in OD.
AMiGA will process your request and create a sub-folder in models with several files including:
key: reduced mapping file for your request.input: data used for hypothesis testing (e.g. Time, OD, …, etc) in long-format.report: summary of the the results of the GP regression test.log: a one-line version of the report summary.params: growth parameters for the growth curves predicted by th model.pdf: plot of the data tested with GP Regression.
Functional difference in OD
In addition to the log Bayes Factor scores, AMiGA will compute the functional difference in the OD between the compared growth curve. This will plot the difference in OD (and its credible interval) over time. In addition, it will summarize the functional difference in OD using \(\Vert OD\Delta\Vert\) which is reported in the log folder as delta_od_sum and delta_od_sum_sig. See Midani et al. (2020) for description of these summary metrics.
Interpretation of model output
See Example for more details on the context of this example.
amiga test -i /home/outbreaks/erandomii -s "Substrate:L-Lactic Acid" -y "H0:Time;H1:Time+Strain" -o "strain_difference_l_lactic_acid" -np 99 -tss 3 --verbose
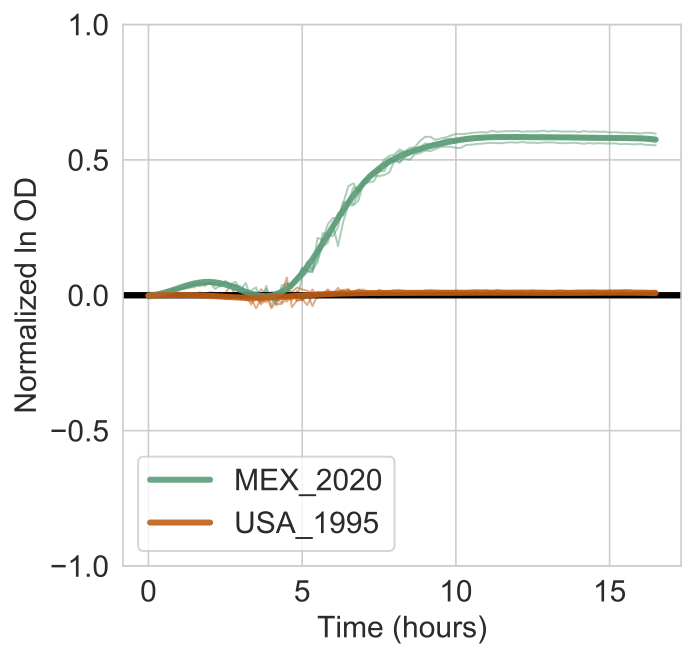
If you run the above command using the example data, a figure will show the models estimated for each strain (bold lines) overlaid on the actual data (thin lines). Shaded bands indicate the 95% confidence interval for the models.

The output report will look like this:
The following criteria were used to subset data:
Substrate......['L-Lactic Acid']

The following hypothesis was tested on the data:
{'H0': ['Time'], 'H1': ['Time', 'Strain']}

log Bayes Factor = 666.990 (0.0-percentile in null distribution based on 100 permutations)

For P(H1|D) > P(H0|D) and FDR <= 10%, log BF must be > 0.937
For P(H0|D) > P(H1|D) and FDR <= 10%, log BF must be < -0.000

The functional difference [95% CI] is 4.300 [4.119,4.481]

Data Manipulation: Input was reduced to 34 equidistant time points. Samples were normalized to their respective control samples before analysis.
This indicates that the log Bayes Factor is 666.99 and much higher than the 10% FDR threshold of 0.937. You are thus very confident that Lactic Acid supports the growth of the MEX_2020 strain but not the USA_1995 strain.
Recall that
\[\text{Bayes Factor} = \exp\left({\log \text{Bayes Factor}}\right) = \exp{(750.722)}\]and
\[\text{Bayes Factor} = \frac{P(H1|D)}{P(H0|D)}\]Therefore, the analysis suggests that the alternative hypothesis that strain differences contributes to differences in growth is more supported than the null hypothesis that only time explains variations in optical density measurements.
Limitations of hypothesis testing
- Testing can only be performed to compare two conditions. In the above example, we compared the growth on the glucose well against growth on the control well.
- If you are comparing data spread across multiple plates, there will be batch effects. To somewhat account for this,
AMiGAcan subtract the growth in control wells from each of your growth curves. To do this, you can use the--subtract-controlargument. If you did not specify the control wells in your mapping files,AMiGAwill not be able to subtract growth in control wells and may eschew this step or the testing may fail.
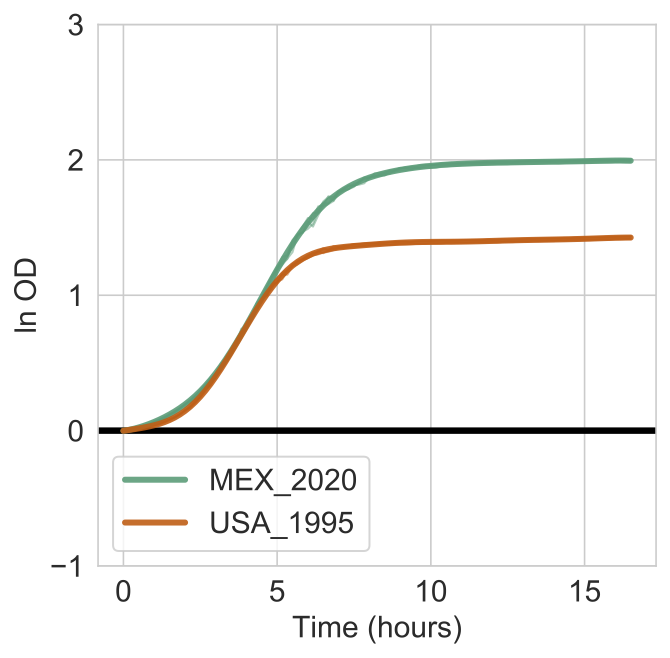
So for the above example, we can re-run it without the --subtract-control argument and we will get the following figure.
amiga test -i /home/outbreaks/erandomii -s "Substrate:L-Lactic Acid" -y "H0:Time;H1:Time+Strain" -o "strain_difference_l_lactic_acid" -np 99 -tss 3 --verbose

Notice how the OD is overall higher for both curves becasue it does not subtract the growth expected or observed on minimal media fore ach strain. By comparing both figures, you can see that all of the growth for USA_1995 on L-Lactic Acid is attributed to the growth simply on minimal media.
Plotting aesthetics
Users can adjust some of the options for the plotting of the models produced by the test functions. In the libs/config.py file (see Configure default parameters), you will find the following key-value pairs:
config['HypoPlotParams'] = {'overlay_actual_data':True,
                           'fontsize':15,
                           'tick_spacing':5,
                           'legend':'inside'}
overaly_actual_dataallows you to include the raw growth curves used by the model (options are eitherTrueorFalse).fontsizeallows you to adjust the size of the font.tick_spacingallows you to adjust the interval for the y-axis grid (or ticks), default is5hours. Recall, that you can also adjust the units of time in thelibs\config.pyfile as well.legendallows to either include the legend box'inside'or'outside'; the value must be in single quotes.
Command-Line arguments
To see the full list of arguments that amiga test will accept, run
amiga test --help
which will return the following message
usage: amiga [-h] -i INPUT [-o OUTPUT] [-f FLAG] [-s SUBSET] [-t INTERVAL] -y
             HYPOTHESIS [-sfn SKIP_FIRST_N] [-tss TIME_STEP_SIZE]
             [-np NUMBER_PERMUTATIONS] [-fdr FALSE_DISCOVERY_RATE]
             [--confidence CONFIDENCE] [--subtract-blanks]
             [--subtract-control] [--verbose] [--fix-noise]
             [--include-gaussian-noise] [--sample-posterior] [--dont-plot]
             [--dont-plot-delta-od] [--save-cleaned-data]
             [--save-mapping-tables] [--save-gp-data] [--merge-summary]
             [--do-not-log-transform]

Test for differential growth between two conditions

optional arguments:
  -h, --help            show this help message and exit
  -i INPUT, --input INPUT
  -o OUTPUT, --output OUTPUT
  -f FLAG, --flag FLAG
  -s SUBSET, --subset SUBSET
  -t INTERVAL, --interval INTERVAL
  -y HYPOTHESIS, --hypothesis HYPOTHESIS
  -sfn SKIP_FIRST_N, --skip-first-n SKIP_FIRST_N
  -tss TIME_STEP_SIZE, --time-step-size TIME_STEP_SIZE
  -np NUMBER_PERMUTATIONS, --number-permutations NUMBER_PERMUTATIONS
  -fdr FALSE_DISCOVERY_RATE, --false-discovery-rate FALSE_DISCOVERY_RATE
  --confidence CONFIDENCE
                        Must be between 80 and 100. Default is 95.
  --subtract-blanks
  --subtract-control
  --verbose
  --fix-noise
  --include-gaussian-noise
  --sample-posterior
  --dont-plot
  --dont-plot-delta-od
  --save-cleaned-data
  --save-mapping-tables
  --save-gp-data
  --merge-summary
  --do-not-log-transform
See more details for these arguments in Command Line Interface