Prepare Data
Table of Contents
- Organizing your working directory
- Preparing your plate reader data files
- Naming your plate reader data files
- Frequently Asked Questions (FAQ)
Organizing your working directory
Before you begin with your first analysis, you need to create a folder which we will refer to as the Working Directory. Here, I name my example as experiment. In this folder, you must have a data sub-folder where you will save all of your data files that need to be analyzed. The folders highlighted in blue will be automatically generated by AMiGA. The mapping folder in orange is an optional folder that you can use to pass meta-data and other similar information to AMiGA. See Preparing Metadata for more details.

Preparing your plate reader data files
AMiGA is designed for the analysis of plate reader data. Plate readers typically measure the optical density in every well of a 96-well microplate at fixed time intervals (e.g. every 10 minutes). These files are often saved as .TXT or .ASC files and may contain run information such as protocol, temperature, … etc., in the first or last few lines of the text file.
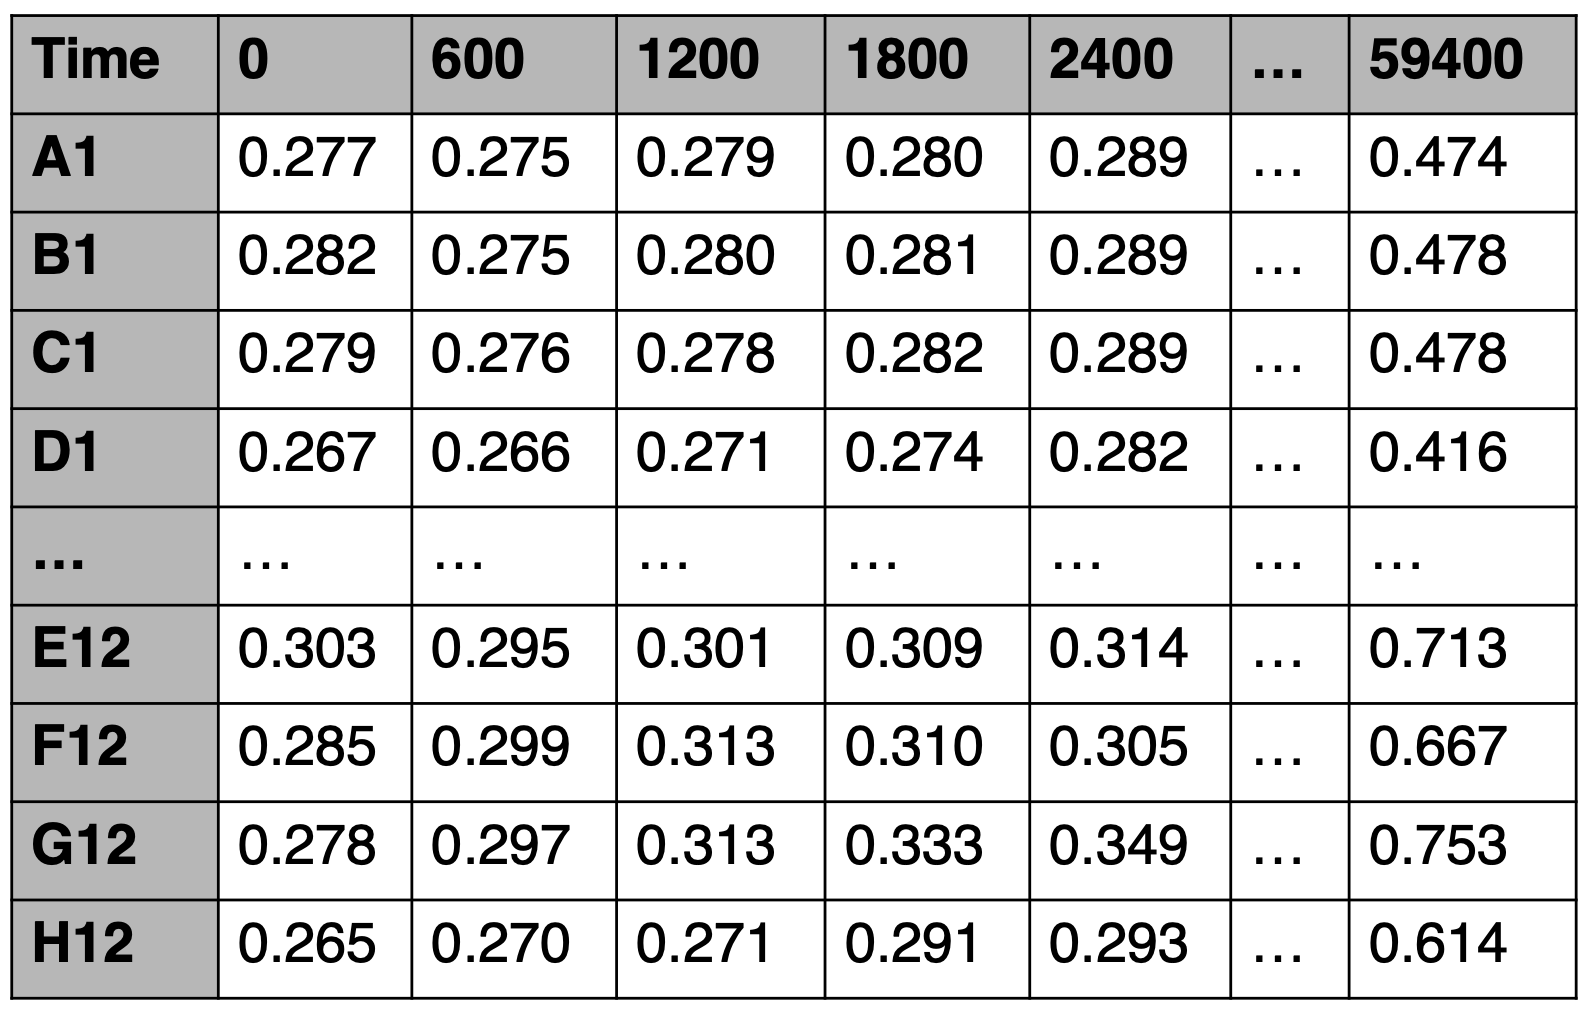
AMiGA expects the data in a specific format, so you will need to clean and format your data before feeding it to AMiGA. The below example describes how to format the data. You can also see an example textfile here which is used in the AMiGA tutorial. Your data should be formatted as follows:
- Rows correspond to wells and columns correspond to time points. The cell values are the measured optical density in each well at a specific time point.
- First column will be the Well IDs. Each well ID must be an uppercase letter followed by a number (no spaces).
- Although AMiGA will ignore this row, the first row can correspond to the time points at which measurements were recorded.
- File must be saved as tab-delimited text file.

Plate readers use different proprietary softwares that export data in slightly different formats. To avoid confusion due to different formats, AMiGA will ignore the time row and will not read it. Instead, it will detect the first line that starts with a well location (e.g. A1 or D13) and read all subsequent lines. Other lines in the text file will simply be ignored. AMiGA will instead rely on the Interval parameter to define the time points. By default this value is 600 seconds (or 10 minutes) but the user can over-ride the default value in the libs/config.py file (see Configure default parameters) or by passing another Interval value as an argument. See Command-line Interface for more details. The defaults must be in seconds but you can also replace the time unit default in libs/config.py.
Naming your plate reader data files
Please use mostly alphanumeric characters in your file names. It is okay to include simple characters such as underscores and dashes.
If you are analyzing Biolog Phenotype Microarray (PM) plates, you can name your data file in a specific way and AMiGA will automatically recognize it as a Biolog PM plate, identify the content in each well on your plate, and include these details in the summary of your growth curves. To do so, please use this nomenclature:
{isolate name}_PM{integer}-{integer}
where the isolate name can be composed of any alphanumeric characters, the first integer indicates the PM number (must be between and including 1 and 7), and the second integer indicates the replicate number. For example, CD630_PM3-2.txt corresponds to the second replicate of growing the isolate CD630 on PM3.
Frequently Asked Questions (FAQ)
Which file formats can AMiGA read?
AMiGA can only read tab-delimited text files which is the typical format for output by plate readers. These can be encoded in ASCII or BOM (e.g. UTF-8). If you have a comma-separated file, you must convert it to tab-delimited or tab-separated file instead.
Can AMiGA read a Microsoft Excel file?
No, please convert the file to tab-delimited text file.
Does AMiGA only process 96-well plates? Can it process 384-well plates? How about data files with an arbitrary number of wells/rows?
AMiGA can read and process data files with any arbitrary number of wells/rows, including 96-well and 384-well plates. It can even read a plate with a single well/row. However, the row names must be well locations (e.g. A1, B1, …, etc.) where first character is an alphabetic letter that corresponds to a specific row in the plate and remaining characters are digits that corresponds to a specific column in the plate
Can AMiGA analyze CFU counts or fluorescence data instead of optical density?
AMiGA should be able to analyze any type of measurement over time, with a couple of caveats. First, AMiGA would need a minimum number of time points to properly fit growth curves (aim for at least eight time points). Second, optical density values typically range between 0 and 5. Fluorescence units are often measured in the thousands. Extreme values or dynamic ranges for measurements could result in numerical instability for GP regression.