Summarize & Plot
Table of Contents
- AMiGA can summarize and plot a 96-well plate
- Typical plot output
- Typical summary output
- How to summarize multiple 96-well plates with a single command?
AMiGA can summarize and plot a 96-well plate
Let us assume that my working directory is
/Users/firasmidani/experiment
and I stored my plate reader file in the data sub-folder
/Users/firasmidani/experiment/data/ER1_PM2-1.txt
First, make sure that you are inside the AMiGA directory
cd /Users/firasmidani/amiga
Second, if you simply would like to plot the raw data in a 96-well grid, you can run the following:
amiga summarize -i /Users/firasmidani/experiment/data/ER1_PM2-1.txt
summarizetellsAMiGAto plot the plate, summarize basic metrics of each curve, and save both.-ior--inputargument will point to the location of the file of interest
Typical plot output
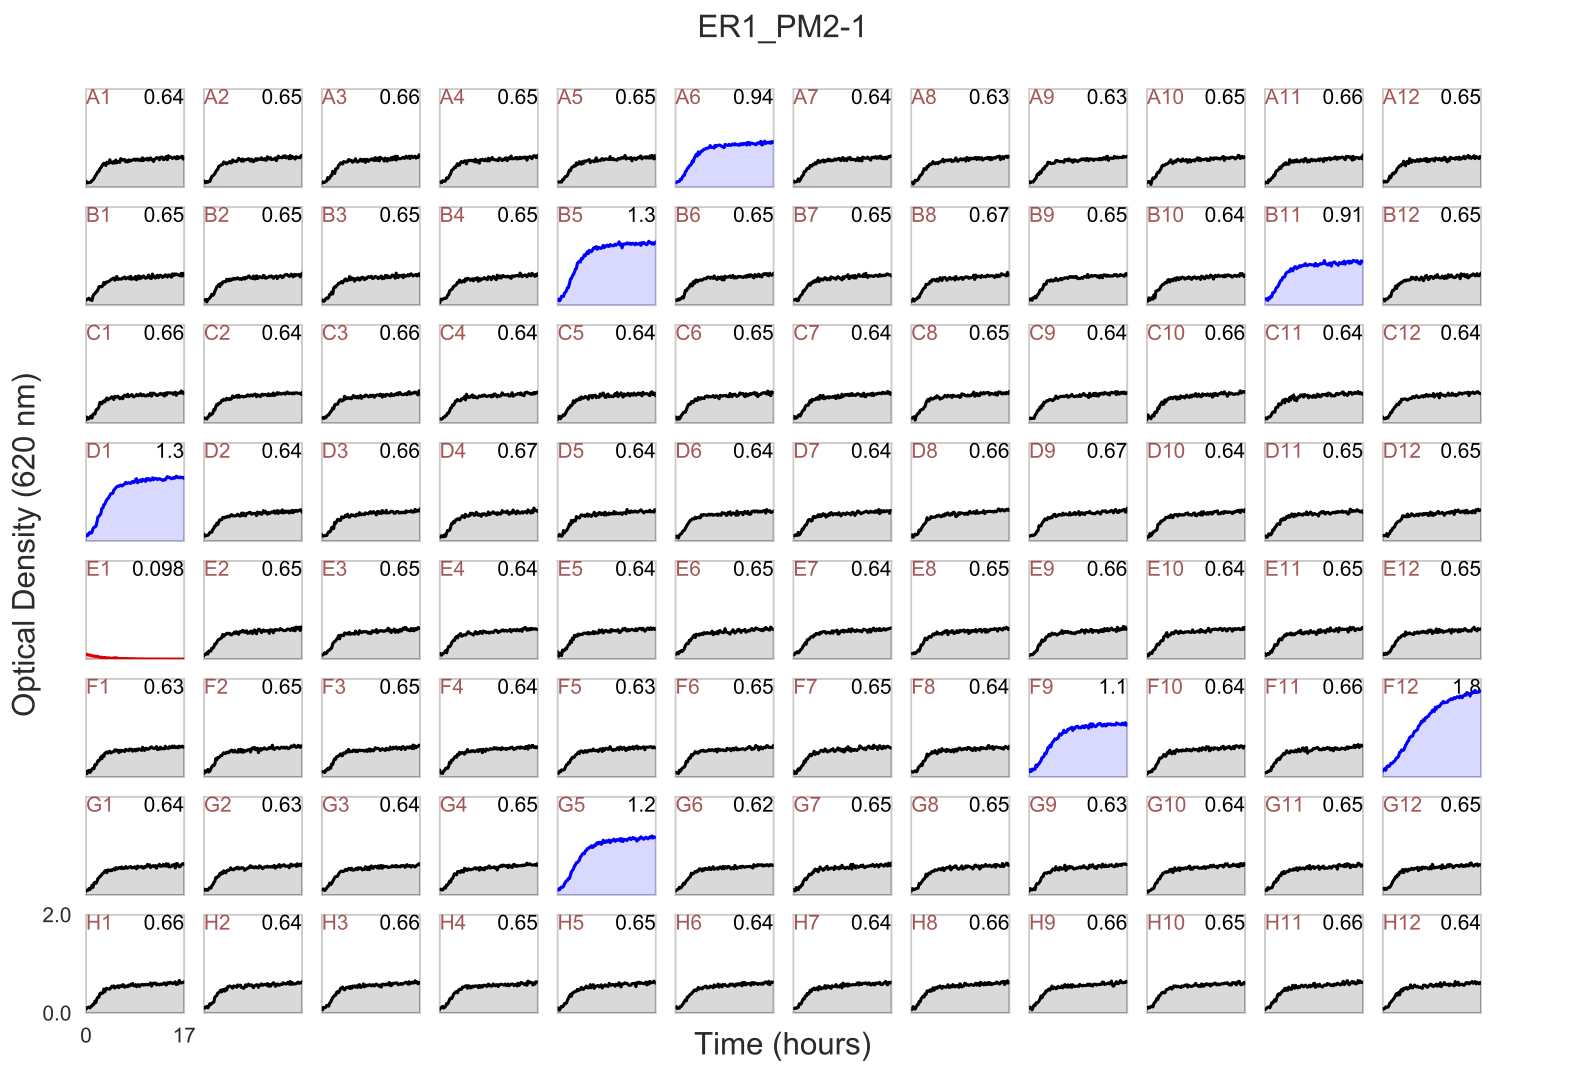
In your /Users/firasmidani/experiment/figures folder, you will find ER1_PM2-1.pdf.

This example shows a Biolog PM2 plate where the A1 well is a negative control well (no carbon substrate). AMiGA computed the fold-change for all wells relative to the negative control well. Fold-change is computed as maximum change in OD in each well relative to the first time point divided by the maximum change in OD in the control well relative to the first time point. The numbers on the top right of each plot is the raw maximum OD in each curve. AMiGA highlighted wells where the fold-change is higher than 1.5 in blue or lower than 0.5 in red. If you want to change the default values for these thresholds, choice of colors, or y-axis label, you can make changes these parameters in libs/config.py file (see Configure default parameters). Color highlighting is only applicable if
Typical summary output
In addition to the plot, AMiGA summarizes the following basic metrics for all growth curves and records these metrics as tables in the summary folder where you will find ER1_PM2-1.txt.
| Metric | Description |
|---|---|
| OD_Baseline | The OD measurement at the first time point |
| OD_Min | The minimum OD measurement at any time point |
| OD_Max | The maximum OD measurement at any time point |
| Fold_Change | defined as the ratio of change in OD of the case (or treatment) growth curve relative to change in OD of the control growth curve |
Here, fold change is mathematically defined as
\[\text{Fold Change} = \frac{ \displaystyle \max \text{OD}_{\text{case}}(t)- \text{OD}_{\text{case}}(0)}{ \displaystyle \max \text{OD}_{\text{control}}(t) - \text{OD}_{\text{control}}(0)} \quad \text{where} \quad\]How to summarize multiple 96-well plates with a single command?
This is super easy. Just point AMiGA to the working directory instead of an individual file. AMiGA will find all of the data files, plot them, and save the figures as PDFs in the figures folder, and save summary tables in the summary folder.
amiga summarize -i /Users/firasmidani/experiment
If you would like one single summary file for multiple plates, you should include the --merge-summary argument and also add the -o argument for naming the output file.
amiga summarize -i /Users/firasmidani/experiment --merge-summary -o all_summary_tables
This will save a single summary file named all_summary_tables_basic.txt. If you do not pass an -o argument, AMiGA will name the file using a unique time stamp.